Yearly Statistics and Plots

|
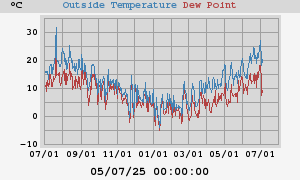
High Temperature Low Temperature |
31.1°C at 02/02/26 22:55:28 -30.0°C at 06/02/26 16:18:13 |
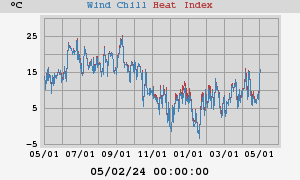
| High Heat Index | 45.9°C at 02/02/26 22:55:28 |
| Low Wind Chill | -23.5°C at 05/01/26 08:26:18 |
|
High Humidity Low Humidity |
97% 07/02/26 09:00:22 0% 11/01/26 19:35:24 |
|
High Dewpoint Low Dewpoint |
36.6°C 02/03/26 09:15:39 -22.8°C 11/01/26 19:35:38 |
|
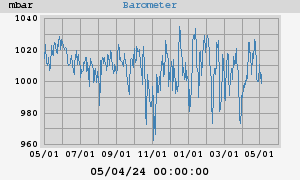
High Barometer Low Barometer |
1028.7 mbar at 29/03/26 05:55:23 971.4 mbar at 11/02/26 21:34:17 |
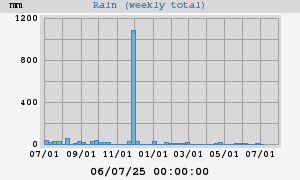
| Rain Total | 359.5 mm |
| High Rain Rate | 21.2 mm/hr at 15/02/26 12:47:49 |
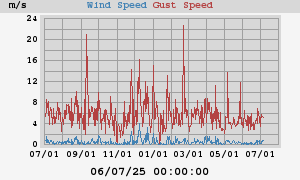
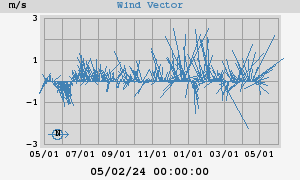
| High Wind Speed | 0.0 m/s from N/A at 10/04/26 05:50:22 |
| Average Wind | 0.0 m/s |
| RMS Wind | 0.0 m/s |
|
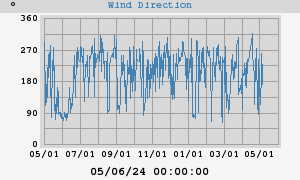
Vector Average Speed Vector Average Direction |
N/A 90° |
|
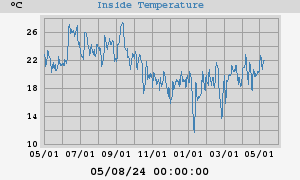
High Inside Temperature Low Inside Temperature |
40.7°C at 05/02/26 00:45:28 10.3°C at 06/01/26 07:05:00 |
| Rain Year Total | 359.5 mm |
| High Rain Rate | 21.2 mm/hr at 15/02/26 12:47:49 |